

Alternative table - Which Premier League teams got most points per million spent last season?

Now that the dust has settled, we can look back on what was a slightly strange, albeit entertaining, Premier League season last term. Liverpool romped to the title in Arne Slot's first season in charge, whilst Manchester United finished 15th and Tottenham ended up 17th. All three promoted teams were relegated straight back to the Championship. Last campaign also represented an interesting season in the transfer window, with plenty of cash splashed by clubs throughout the English top-flight. With this in mind, here at Transfermarkt, we have compiled an alternative Premier League table for the 2024/25 season based on which clubs gained the most points for every €1 million spent. It determines which clubs got an incredible return for their money, and which sides saw little immediate benefits from their investments.
2024/25 Premier League table based on points gained per million spent
In both the actual table, and our alternative table Liverpool take first place, and it can come as no great surprise. The Reds spent just €42 million last summer on Federico Chiesa, and goalkeeper Giorgi Mamardashvili, who they loaned straight back to Valencia, yet they won the league title comfortably. Slot's team picked up 84 points, meaning that they gained 2.00 points for every €1m they spent last term - an incredible achievement. In second place at less than half of Liverpool's total are Newcastle, with the Magpies picking up 0.97 points per million spent. Eddie Howe's team spent just €68.2m across last season and picked up 66 Premier League points.
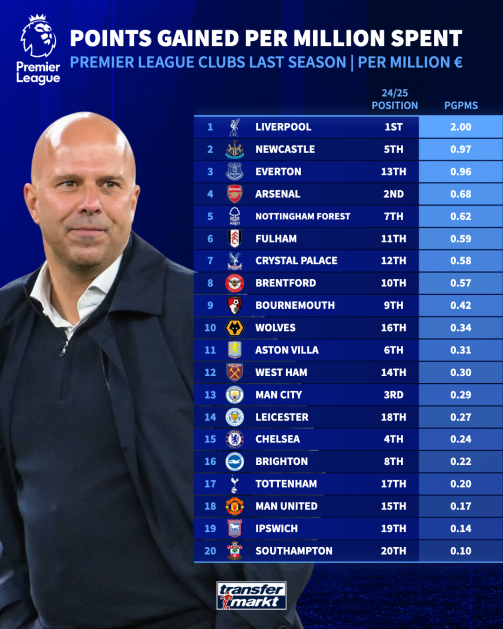
Everton, who finished 13th in the actual table, actually take third spot, having accumulated 0.96 points for every million spent last season. Arsenal complete the alternative top four, but with a huge drop from the Toffees figure, with 0.68 points per million for the Gunners. Nottingham Forest (0.62 points per million) take fifth, with Fulham (0.59), Crystal Palace (0.58), Brentford (0.57), Bournemouth (0.42) and Wolves (0.34) also in the top 10. Manchester City who finished third last term, are as low as 13th in this table, having spent €243m across the season only to gain 71 points - equating to 0.29 points per million spent.
Meanwhile, Chelsea, who finished fourth, are 15th with a figure of 0.24 points per million. The actual table last season already made for pretty grim reading for Man United and Tottenham fans, and this one is not much better. Tottenham take the same position in 17th with 0.20 points per million, whilst in our alternative list, the Red Devils would actually be relegated with just 0.17 points per million spent. These figures and the above graphic can go a good way to telling us which sides can be happiest and most disappointed with their transfer business last term. Although, of course not all investments come to fruition straight away, and some of the teams lower on the list will be hoping for a better return on some of their signings this upcoming season.


- Total Market Value:
- €1.08bn
- Competition:
- Premier League
- Manager:
- Arne Slot
- Squad size:
- 29
- Latest Transfer:
- Hugo Ekitiké

- Total Market Value:
- €677.90m
- Competition:
- Premier League
- Manager:
- Eddie Howe
- Squad size:
- 27
- Latest Transfer:
- Aaron Ramsdale

- Total Market Value:
- €312.20m
- Competition:
- Premier League
- Manager:
- David Moyes
- Squad size:
- 22
- Latest Transfer:
- Kiernan Dewsbury-Hall

- Total Market Value:
- €822.20m
- Competition:
- Premier League
- Manager:
- Ruben Amorim
- Squad size:
- 31
- Latest Transfer:
- Bryan Mbeumo

- Total Market Value:
- €839.10m
- Competition:
- Premier League
- Manager:
- Thomas Frank
- Squad size:
- 32
- Latest Transfer:
- João Palhinha

